


Table of Contents
Overview
Multi-GPU Workstations
Powerwalls and Display
Walls
Visualization
Clusters
Overview
This page documents scalability studies conducted on various hardware setups. Scalability dependends on the application's rendering code as well as the hardware setup. These benchmarks provide snapshots of a typical setup, and constant improvements in Equalizer deliver even better performance.
Related Presentations
- Parallel rendering on hybrid multi-GPU clusters: html pdf
- Fast compositing for cluster-parallel rendering: html pdf
- Scalable parallel out-of-core terrain rendering: html pdf
Multi-GPU Workstations
Multi-GPU systems, such as dual-SLI or quad-SLI workstations or the Apple Mac Pro are becoming more commonplace. Equalizer provides the natural framework to fully exploit the parallelism of such hardware. Equalizer applications are capable of optimally using the graphics cards as well as multiple CPU cores typically present in multi-GPU workstations. Application-transparent solutions such as SLI or Crossfire provide less scalability, since the application's rendering is still single-threaded and not optimized for the individual cards.
Example 1: HP xw9300 workstation
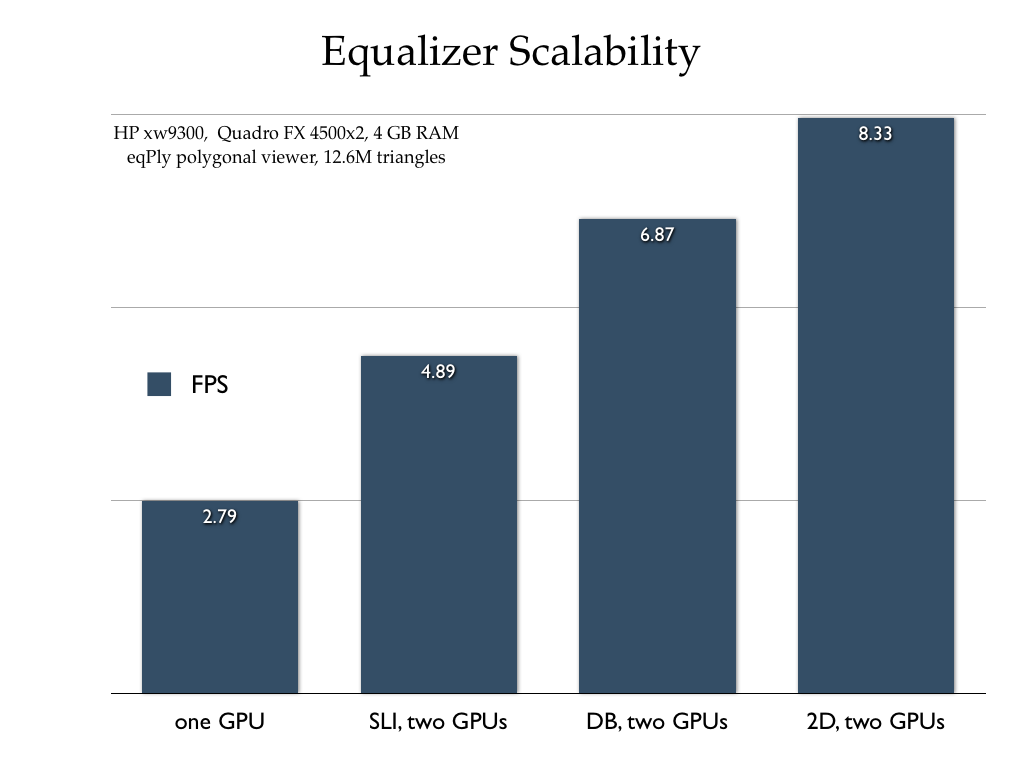
The example on the right shows the performance benefit of Equalizer compared to the default application-transparent SLI mode. The first configuration measures the baseline performance using only a single GPU. The second one uses the same Equalizer configuration, but transparently distributed across the two GPUs by SLI. The two remaining configurations are using two rendering threads with a database (sort-last) decomposition and a screen-space (sort-first) decomposition. These decompositions scale the rendering performance of a single view, similar to SLI mode but using two processor cores for rendering to optimize the data sent to each GPU. The pixel transfer does not use the SLI hardware, but is executed through main memory, the slowest possible path. The example used is the stock Equalizer polygon rendering application, using a data set of 12.6 million triangles.
Example 2: Apple Mac Pro
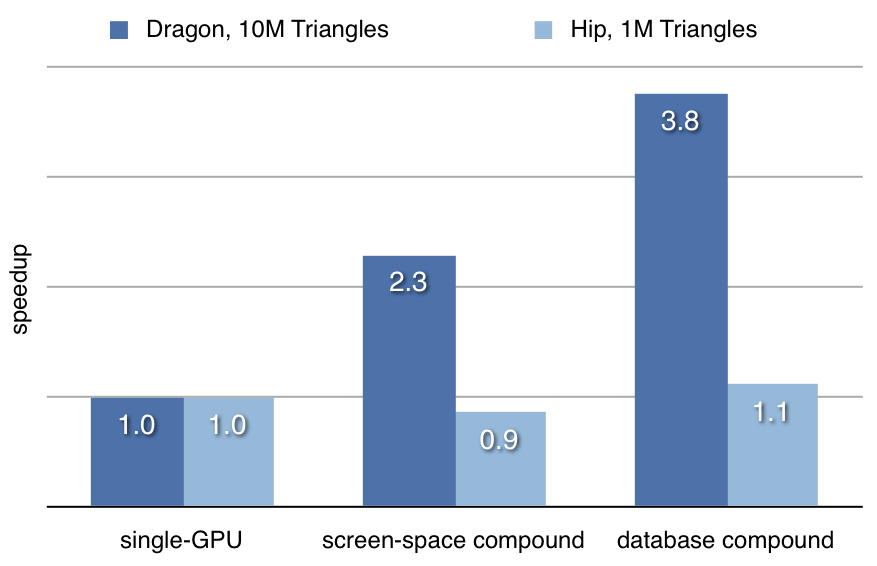
The performance speedup of a dual-GPU Mac Pro is similar to the HP workstation. The benchmarks shows in addition to a medium-sized model also a small model, which naturally does not scale. The test machine is a quad-core Mac Pro with 12 GB memory and two ATI x1900 graphics cards.
Powerwalls and Display Walls
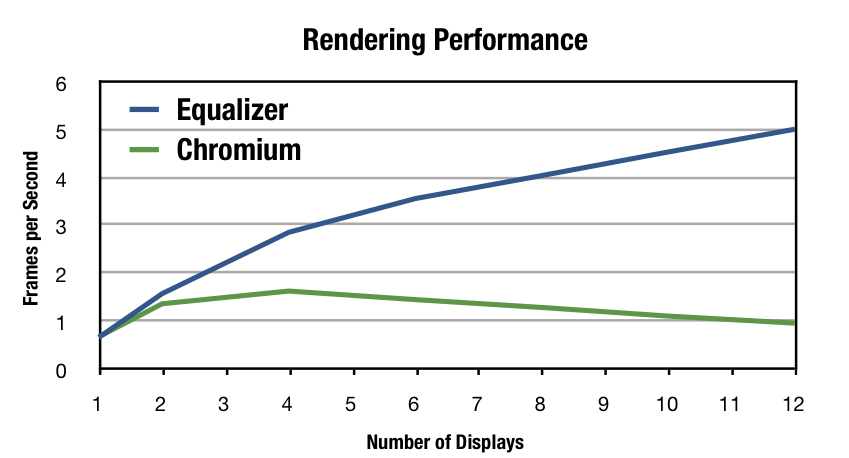
Large-scale display systems, such as display walls and multi-projector systems, are often driven by a number of rendering nodes. A planar display wall can be driven by using an OpenGL interceptor, for example Chromium. Since these solutions are transparent to the application, they provide a cost-effective solution.
Transparency comes however at a price, even for a simple setup such as a planar projection. Using a parallel Equalizer application, much better performance and scalability can be achieved. Furthermore, an Equalizer-based application does not have any compatibility issues for certain OpenGL features or extensions, since the rendering code directly accesses the GPU on each backend node.
The white paper Two Methods for driving OpenGL Display Walls describes this performance study.
Visualization Clusters
Graphic clusters are virtually unlimited in the number of possible processors and graphics cards. The software scalability on such cluster is a relatively new field, compared to compute clusters. Equalizer is pushing the boundaries on what is possible by bringing more applications to this environment.
Example 1: Volume Rendering
Volume rendering is a prime candidate for scalable rendering. A database decomposition is easily done by bricking the volume, and the recomposition uses less pixel data, since even for a database recomposition only RGBA data is needed. Furthermore, the decomposition is easy to load-balance and scales nicely all aspects of the rendering pipeline.
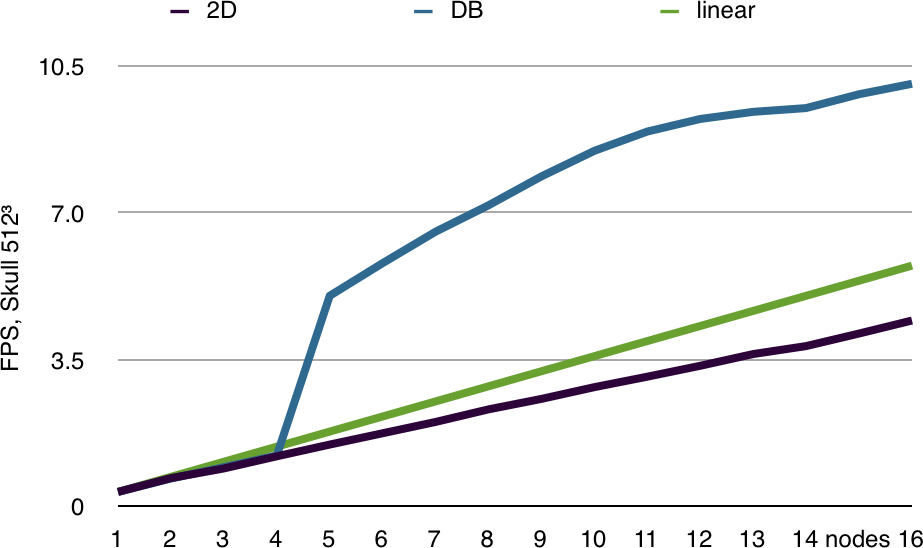
Database (sort-last) volume rendering allows to visualize data sets which do not fit on a single GPU, since the individual graphics cards only need to render a sub-volume of the whole data set. The benchmark on the right shows this effect clearly. Up to four rendering nodes the volume brick does not fit on the the GPU. Afterwards, it gets small enough that it can be completely cached on the GPU, and performance immediately jumps by an order of magnitude. The screen-space decomposition always has to hold the full volume texture and can therefore only scale sub-linearly.
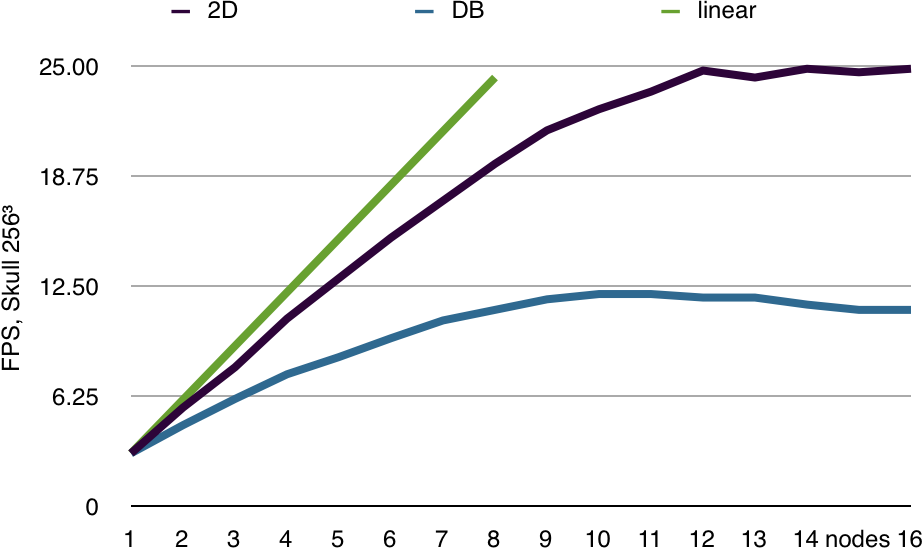
The same data set at a lower resolution always fits into GPU memory. The benchmark on the right shows nicely the scalability limits of the used graphics cluster. The readback, transfer and compositing pipeline limits the performance to 25 fps at a resolution of 1280x1024. When using a database decomposition, twice the amount of data has to be handled by each node, thus limiting the performance to 12.5 fps.
This performance limitation is a mostly hardware bottleneck, mostly caused by the slow interconnect on the cluster. Framerates of up to 60 Hertz are possible with a properly tuned system.
Example 2: Polygonal Rendering
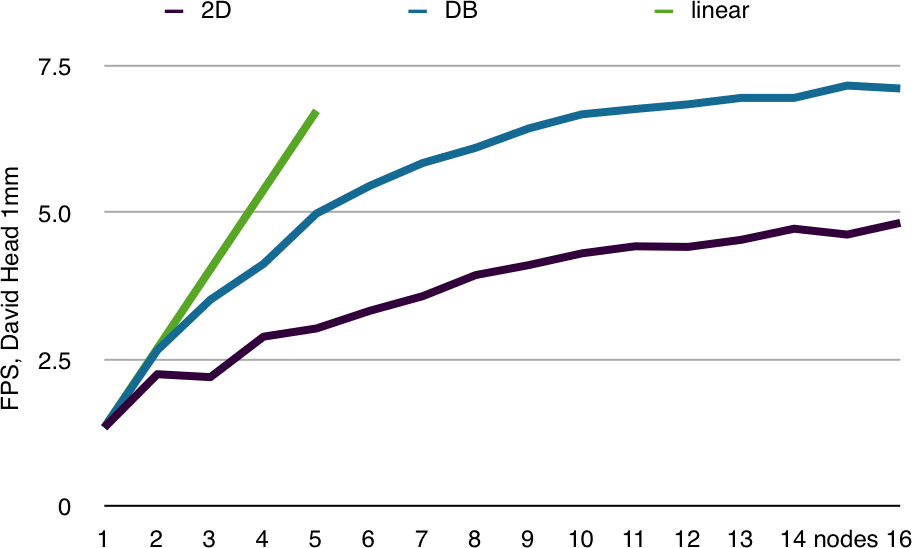
Polygonal data sets have the disadvantage that the database recomposition is twice as expensive, since both color and depth information is processed. Furthermore, load balancing is harder compared to volume rendering since the data is less uniform. The benchmark results therefore show that the hardware limits the rendering to 7.25 fps, half of the volume rendering performance. Screen-space decomposition again suffers performance due to the fact that the whole model has to be loaded on each node. This polygonal rendering benchmark is much less fill-bound than the volume rendering benchmark.