Author: eilemann@gmail.com
State: Implemented in 0.5.1
Overview
Statistics are send as events to the application node. On the application
node, Config::handleEvent sorts the events per frame and per
originator (channel, window, config). Events for up to latency +
1 frames are kept by the eq::Config on the application
node.
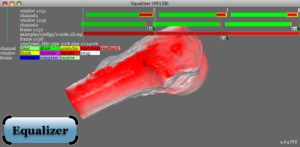
Statistics can be visualized by calling Channel::drawStatistics.
The Equalizer examples use the 's' key to toggle statistics drawing on and
off.
Details

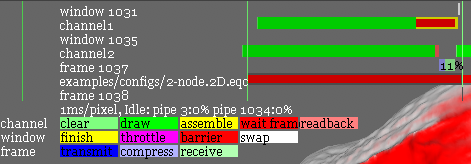
Statistics Overlay with Explanations
- The statistics are for a static 2D compound using two nodes.
- The X axis is the time. One pixel on the screen corresponds to one millisecond. The right-most pixel is the most current time.
- On the Y axis are the rendering entities: channels, windows and the config.
- The draw times are unbalanced due to the load imbalance of a static 2D compound.
- Frames overlap due to asynchronous execution, in the example above for one frame.
- The percentage on the frame compress statistic is the compression ratio, in this case the data was compressed down to 11% of the original size during network transport.
- Older frames are gradually attenuated for easier identification of tasks to frames.
- Frame borders are identified by vertical lines, green is the start of a frame, gray the finish.
- The swap buffer task includes the time to wait for the vertical retrace (vsync is on).
- The waiting for images task is a subset of the assemble task.
API
virtual void Channel::drawStatistics();
File Format
Additional statistics file format:
  global
  {
      EQ_WINDOW_IATTR_HINT_STATISTICS    off | fastest [on] | nicest
  }
  window
  {
      attributes
      {
          hint_statistics     off | fastest [on] | nicest
      }
  }
Open Issues
None
3D model courtesy of Cyberware, Inc.


